Six apps, running now.
every card opens a live deployment · uptime comes from our monitor’s public API
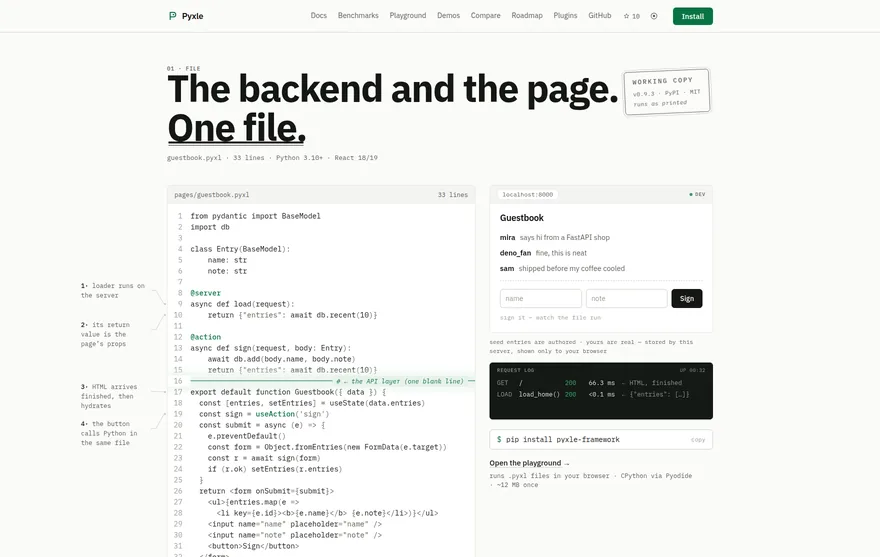
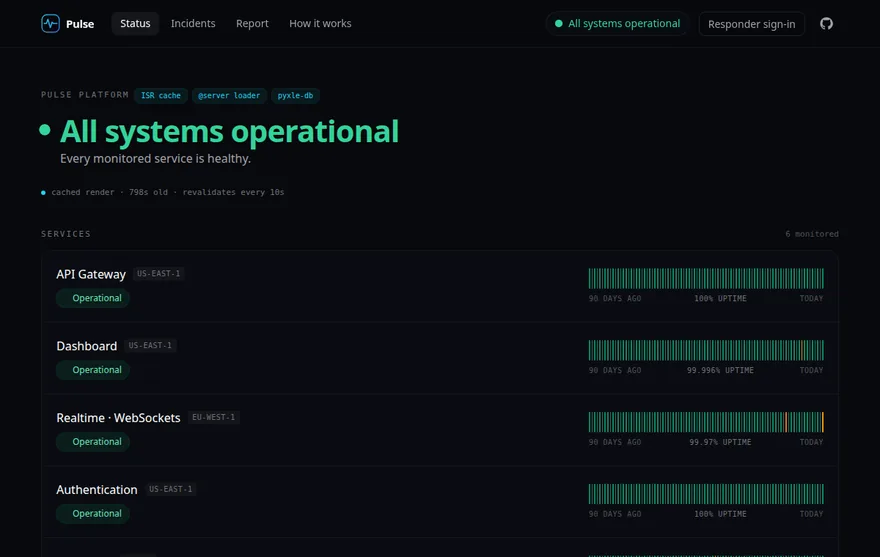
The three we run in production.
real screenshots, live URLs — click them · uptime is the monitor’s own, never typed

Three more, built to show one thing each.
smaller apps, same physics — every row opens a live deployment
Chroma liveColor palettes computed by Python’s colorsys — the loader does the math, the page just prints it.up 100.00% · 35d observedchroma.pyxle.app →
Flux liveA SaaS analytics dashboard — charts server-rendered from one @server loader.up 99.99% · 35d observedflux.pyxle.app →
Glyph liveGeometric patterns from server-side math.sin — regenerate is a real round trip.up 100.00% · 35d observedglyph.pyxle.app →
Open source. MIT. Self-hosted. No cloud tax.
Every app on this page runs on plain ASGI boxes we operate ourselves. Nothing here is a mockup — the uptime on each card is measured by our own monitor, and when one goes down, this page says so.
github.com/pyxle-dev/pyxle · MIT · v0.9.4